If the website responds slowly, please go here
TIMER is a comprehensive resource for systematical analysis of immune infiltrates across diverse cancer types. This version of webserver provides immune infiltrates' abundances estimated by multiple immune deconvolution methods, and allows users to generate high-quality figures dynamically to explore tumor immunological, clinical and genomic features comprehensively.
Geting started by exploring:Gene_Outcome: association between gene expression and clinical outcome;
Gene_Mutation: differential gene expression between mutation status on gene;
Gene_Corr: correlation between genes.
Note: the estimation scores of TIMER2.0 might differ slightly from previous versions of TIMER due to the different number of available TCGA samples used for batch correction in the current run.
Tutorial:Cite us!
Taiwen Li#, Jingxin Fu#, Zexian Zeng, David Cohen, Jing Li, Qianming Chen, Bo Li, and X. Shirley Liu. TIMER2.0 for analysis of tumor-infiltrating immune cells. Nucleic Acids Research 2020 [DOI] [PubMed]
Taiwen Li, Jingyu Fan, Binbin Wang, Nicole Traugh, Qianming Chen, Jun S. Liu, Bo Li, X. Shirley Liu. TIMER: A web server for comprehensive analysis of tumor-infiltrating immune cells. Cancer Research. 2017;77(21):e108-e110. [DOI] [PubMed]
Bo Li, Eric Severson, Jean-Christophe Pignon, Haoquan Zhao, Taiwen Li, Jesse Novak, Peng Jiang, Hui Shen, Jon C. Aster, Scott Rodig, Sabina Signoretti, Jun S. Liu, X. Shirley Liu. Comprehensive analyses of tumor immunity: implications for cancer immunotherapy. Genome Biology. 2016;17(1):174. [DOI] [PubMed]
Taiwen Li:
litaiwen@scu.edu.cn
Jingxin Fu:
jxfu@ds.dfci.harvard.edu
X Shirley Liu:
xsliu@ds.dfci.harvard.edu
User Visiting Statistics
TIMER v2.0 | © X Shirley Liu Lab 2020 | Dana Farber Cancer Institute
Modules exploring the association between immune infiltrates and genomic changes or clinical outcome in TCGA:
Instruction: Gene module allows users to select any gene of interest and visualize the correlation of its expression with immune infiltration level in diverse cancer types. Once your interested gene and immune infiltrates submitted, a heatmap with numbers will show the purity-adjusted spearman's rho across various cancer types. When you click your interested cell on the heatmap, a scatter plot will pop out to present the relationship between infiltrates estimation value and gene expression. Tumor purity is a major confounding factor in this analysis, since most immune cell types are negatively correlated with tumor purity. Therefore, we recommend users to select the “Purity Adjustment” option, which will use the partial Spearman’s correlation to perform this association analysis. Specially, for methods like EPIC and quanTIseq, which provide cell fractions referred to total cells, tumor purity and immune infiltration are necessarily negatively correlated, hence there is no need to adjust purity for the asscociation analysis using the estimations from EPIC and quanTIseq.
Instruction: Mutation module allows users to analyze and visualize the effect of gene mutations on immune cell infiltration across multiple cancer types and immune cell types simultaneously. User can input a gene by either manually typing the gene name or selecting from a list of commonly mutated genes ordered by mutation frequency. Given the input gene, TIMER2.0 displays a bar plot showing mutation frequency of the gene for each TCGA cancer type. When the user specifies the immune cell type and clicks submit, TIMER2.0 presents a heatmap table of the log-fold changes of immune infiltration level between tumors with the input gene mutated and tumors without. User can click an entry on the heatmap to see violin plots of immune infiltration distribution in the mutant vs wildtype tumors.
Instruction: sCNA Module allows a user to compare immune infiltration distribution by the sCNA status of a gene across TCGA cancer types. GISTIC2.0 (25) estimates the sCNA information from copy number segmentation profiles at the gene level, including “deep deletion”, “arm-level deletion”, “diploid/normal”, “arm-level gain”, and “high amplification” defined by GISTIC2.0. Given the input gene, TIMER2.0 displays a stacked bar plot showing the relative proportion of different sCNA states of the gene for all TCGA cancer types. TIMER2.0 requires the user to specify a “deep deletion” or “high amplification” alteration status of the gene to compare with the “diploid/normal” status. When a user submits a query, TIMER2.0 draws a heatmap table for the log-fold changes of immune infiltration levels between the specified alteration group and the normal one. With a click on an entry of the table, the user can view the immune infiltration distribution between different sCNA status of the gene on a violin plot for pairwise comparisons of normal group with each alteration group.
Instruction: Outcome module allows users to explore the clinical relevance of tumor immune subsets, with the flexibility to correct for multiple covariates in a multivariable Cox proportional hazard model. Covariates could be clinical factors or gene expression. Once variables are submitted, TIMER will do the cox regression as the model section shows, and then present the normalized coefficient of the infiltrate for each model across multiple cancer types in a heatmap. It should be noted that each cell of heatmap corresponds to an independent cox model. We don't include multiple infiltrates into one model.
The pop-up function by click the cell will display Kaplan-Meier curves for the corresponding immune infiltrates and cancer types. The infiltration level is divided into low and high levels which could be adjusted by a user-defined slider. The hazard ratio and p value for Cox model and the log-rank p value for KM curve will be shown on the KM curve plot.
Modules exploring associations between gene expression and tumor features in TCGA:
Instruction: Gene_DE module allows users to study the differential expression between tumor and adjacent normal tissues for any gene of interest across all TCGA tumors. Distributions of gene expression levels are displayed using box plots. The statistical significance computed by the Wilcoxon test is annotated by the number of stars (*: p-value < 0.05; **: p-value <0.01; ***: p-value <0.001). Users can identify genes that are up-regulated or down-regulated in the tumors compared to normal tissues for each cancer type, as displayed in gray columns when normal data are available.
Instruction: Gene_Outcome module provides the clinical relevance of gene expression across various cancer types. Like the Outcome module, Gene_Surv uses Cox proportional hazard model to evaluate the outcome significance of gene expression, optionally adjusted by clinical factors. Heatmap will be drawn to show the normalized coefficient of the gene in Cox model. Pop-up by the cell-clicking function of heatmap will show the KM curve of the gene.
Instruction: Gene_Mutation module compares the differential gene expression between different mutation status. You need to input your interested gene with mutations and a gene list. Once submitted, heatmap shows the log2 fold changes of the differential expression of each gene for each cancer type. The cell-clicking event will give you a pop-up boxplot to show the details.
Instruction: Gene_Corr module is to explore the correlation between your interested gene with a list of genes in various cancer types. Heatmap gives your the purity-adjusted partial spearman's rho value as the degree of their correlation. Select the 'Purity Adjustment' checking box if you want the association to be adjusted.
Instruction:
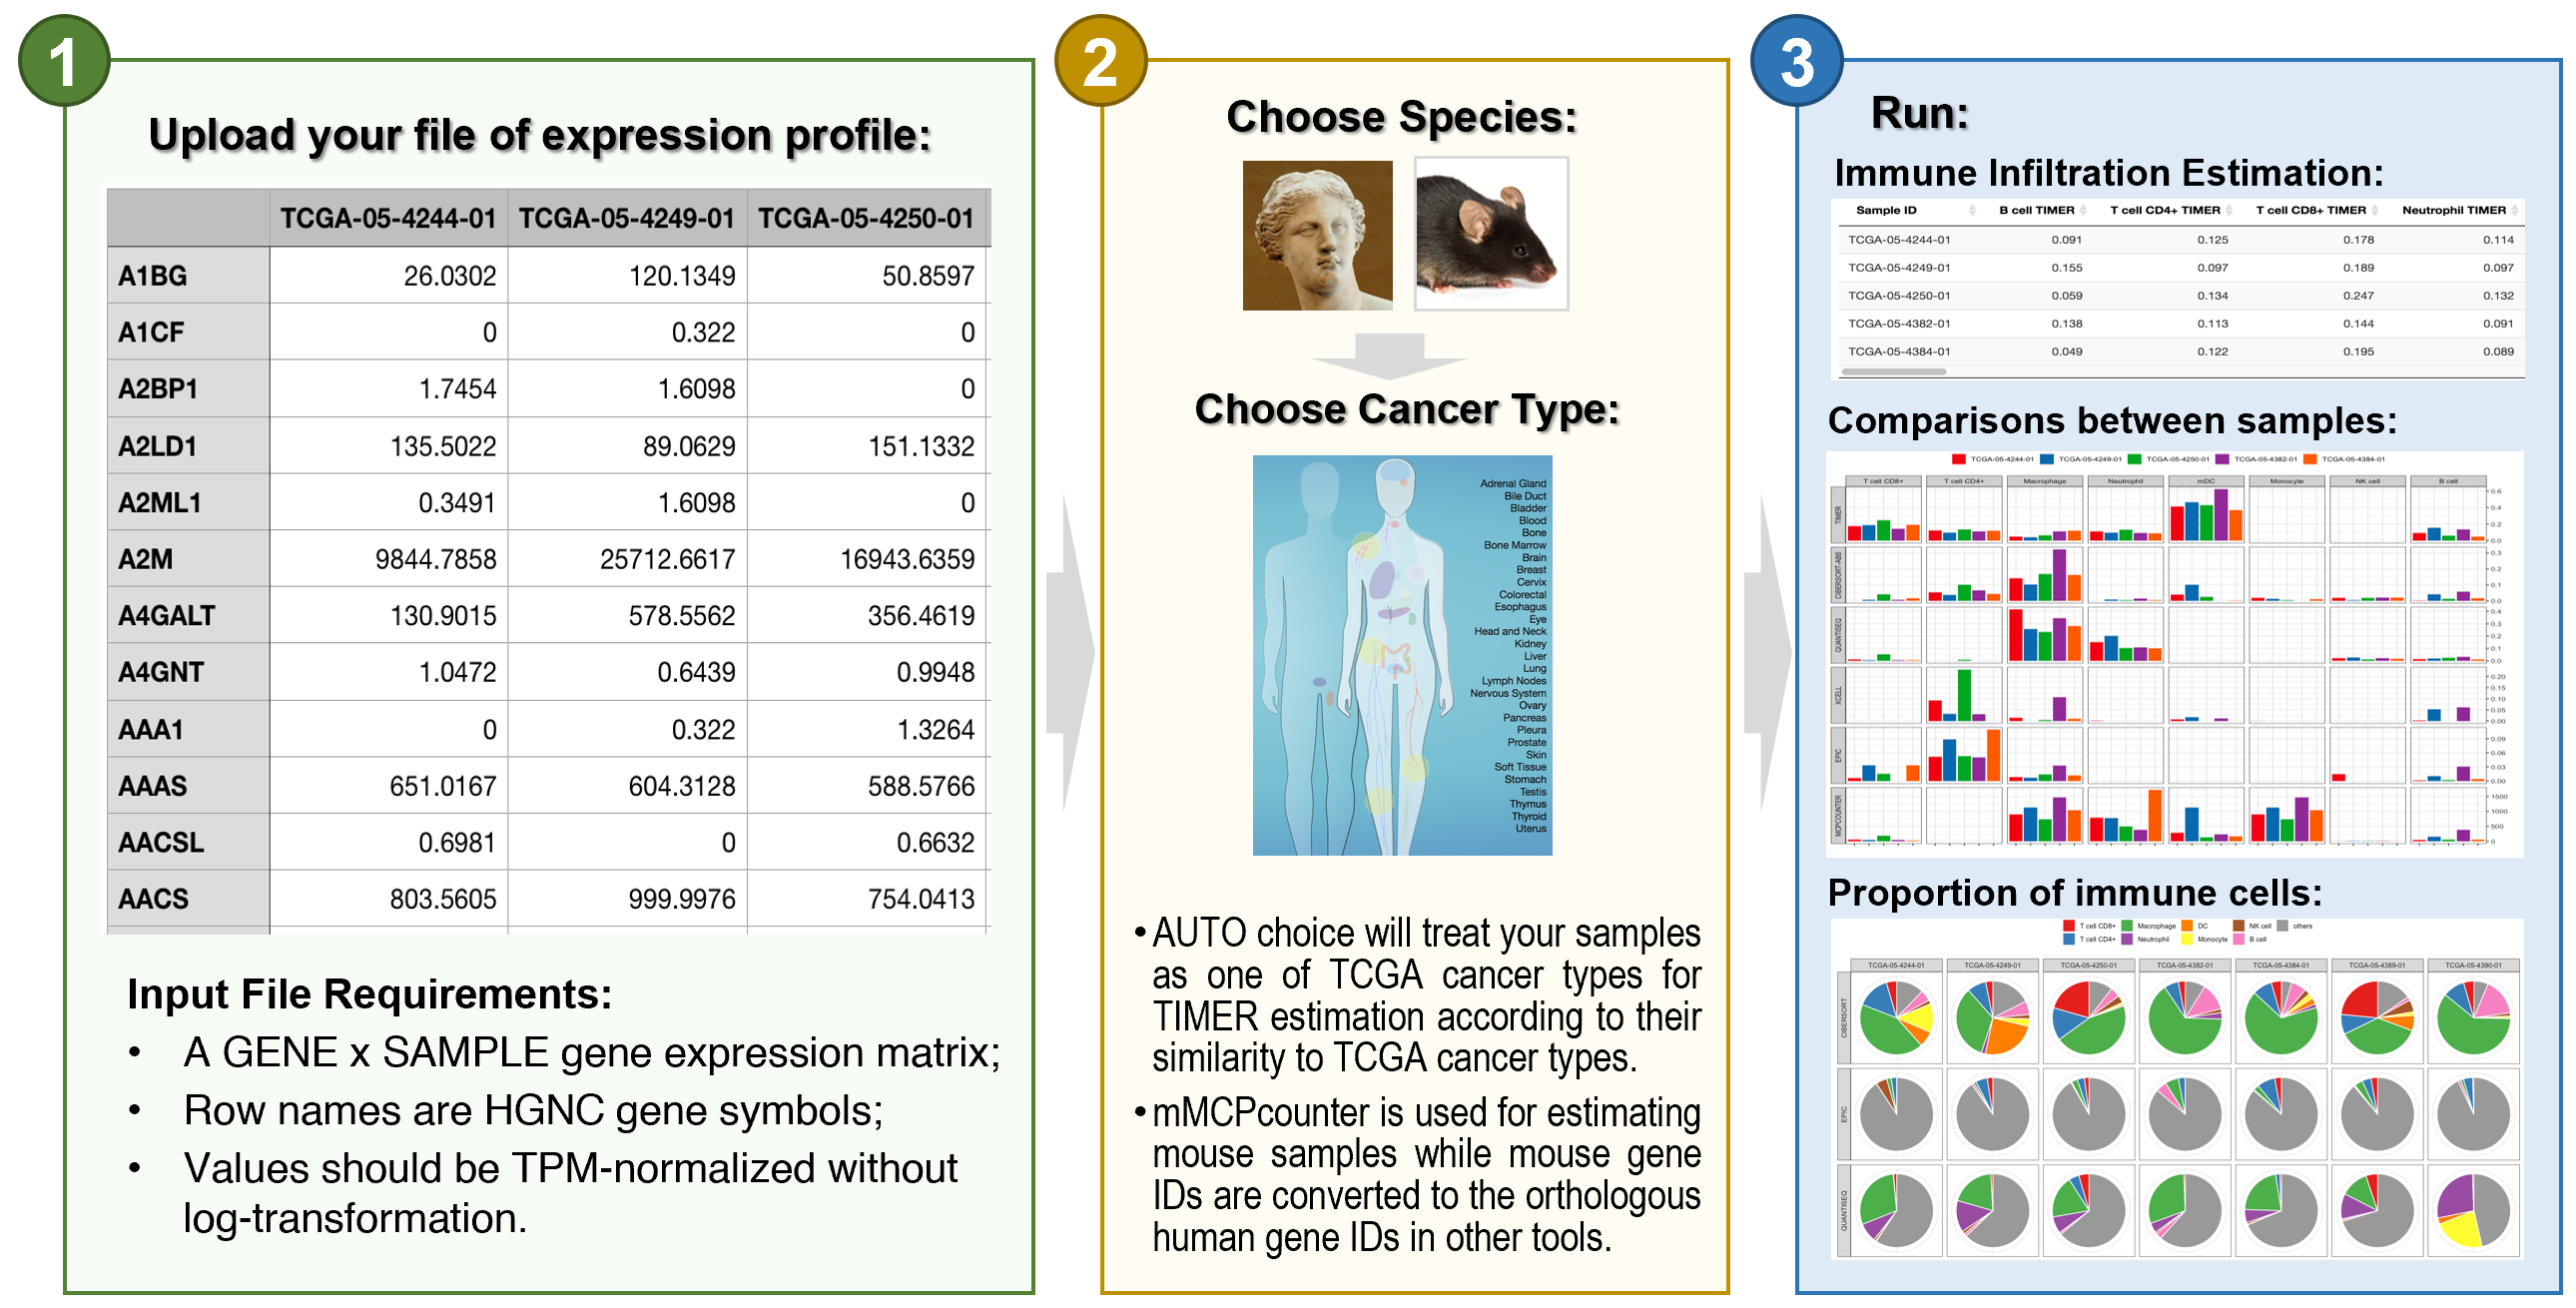
- Example File of expression profiles for five TCGA LUAD tumors
- Infiltration Estimation for all TCGA tumors
- Go to the download page of the TIDE website for downloading TIDE estimation of all TCGA tumors
- If you used the estimation results, please also cite immunedeconv with TIMER, CIBERSORT, quanTIseq, xCell, MCP-counter (or mMCP-counter for mouse) and EPIC methods as well.